
Is this a 2018 Re-run?
There is something familiar about the increasingly nervous behaviour of equity markets ahead of November’s US midterm elections. The last time Donald Trump faced voters halfway through a presidential term, investors were also questioning a long advance in technology shares and the influence of a determined Federal Reserve. The outcome was uncomfortable: the final quarter of 2018 followed by an extraordinary recovery in 2019. The two charts below make the comparison tempting, although history offers a warning about the journey rather than a timetable for the destination.
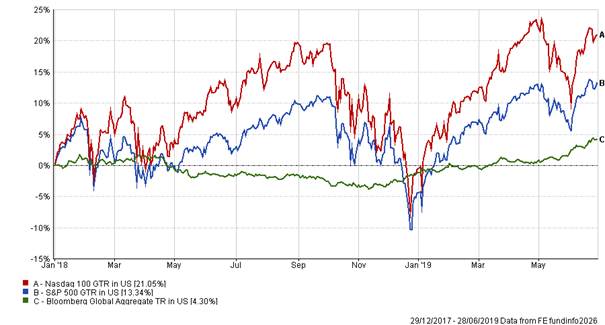
2018–19: Nasdaq 100 and S&P 500 gross total returns, and Bloomberg Global Aggregate total return, in US dollars. 29 December 2017–28 June 2019. Source: FE fundinfo.
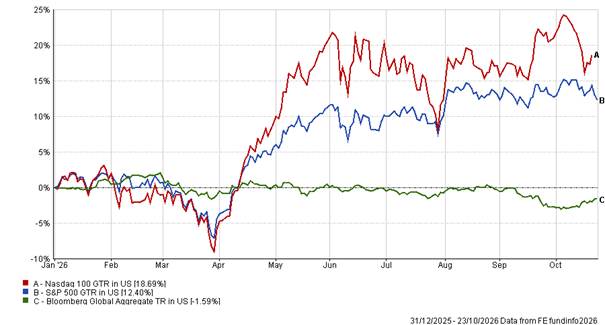
2026: the same index series in US dollars, 31 December 2025–23 October 2026. The periods differ in length; these charts illustrate market behaviour rather than comparable holding-period or sterling investor returns. Source: FE fundinfo.
The Ghost of Christmas 2018
In 2018, technology had led markets higher before tightening monetary policy, trade tensions and doubts about growth overwhelmed confidence. The midterms on 6 November did not mark the low: the fiercest selling came in December, with the S&P 500 down almost a fifth from its autumn peak by Christmas Eve. The subsequent rebound in 2019 was a reminder that the worst moment to be invested is not always the worst moment to invest.
The Federal Reserve also changed its stance, moving from December’s rate increase to an explicitly patient approach in January 2019. The recovery therefore involved more than the passing of an election.
Today’s pattern is similar in spirit, but not in scale. The S&P 500 fell only 0.50% last week and the Nasdaq Composite 0.70%, measured by US-dollar price-index changes between 16 and 23 October, despite sharper selling in individual AI shares. Both remain positive for 2026. This year also brought an April correction followed by a substantial recovery. There was a sharp correction early in 2018 too, although the timing and scale of the subsequent moves differed. The market is not following the same script, but the combination of strong earnings and weakening confidence feels familiar.
Crucially, the 2018 buying opportunity arrived after the midterms, not necessarily because of them. November 3 should not be treated as an automatic turning point; monetary and economic conditions will decide what follows.
Cheaper, but Not Necessarily Cheap
The divergence between prices and earnings has brought substantial valuation compression. The S&P 500 technology sector’s forward P/E has fallen from 26.5 times at the end of 2025 to around 19; the broader index has moved from 22.2 to below 19. The Magnificent Seven have fallen from a 2026 peak near 28.5 times to around 22.8. The accompanying chart shows the wider derating in mega-, large-, mid- and small-cap shares through 15–16 October; the more recent figures above extend that picture.
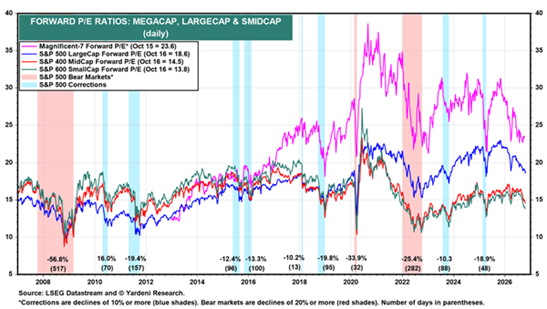
Forward P/E ratios, 2008–October 2026. Latest observations: 15 October for the Magnificent Seven; 16 October for the S&P 500, S&P 400 MidCap and S&P 600 SmallCap. Multiples of expected next-twelve-month earnings. Source: LSEG Datastream / Yardeni Research.
Technology now trades on a multiple close to that of the wider market, despite stronger near-term earnings growth. Calling it cheap requires caution: semiconductor profits are cyclical and memory-chip pricing cannot remain exceptional forever. A company whose earnings rise to nine times their previous level and then grow another 60% is still enjoying remarkable growth; what has slowed is its growth rate. Markets react to that deceleration well before profits fall.
A Voting Machine, Then a Weighing Machine
Benjamin Graham’s description of the market as a voting machine in the short run and a weighing machine in the long run seems particularly apt. Investors are voting against the risks of expensive AI investment, higher borrowing costs and overly ambitious expectations. Eventually they will weigh what companies earn, and on that measure the picture remains encouraging.
With 24% of S&P 500 companies reporting, FactSet’s blended estimate—combining reported results with forecasts for companies yet to report—puts third-quarter earnings growth at 29.5% year on year and revenue growth at 12.7%. Some 83% have beaten earnings estimates, yet the aggregate surprise is only 2.1%, below the five-year average of 7.5%. That comparison is with completed reporting seasons, and Meta’s litigation charge has weighed on the aggregate beat. The numbers are exceptional, but not quite exceptional enough for a market conditioned to expect more.
Yardeni’s next-twelve-month earnings estimate for the S&P 500 reached a record near $414 a share during the week of 22 October, with forward earnings estimates for smaller companies also advancing. The large-cap estimate has risen roughly 31% since year-end, against an approximately 11% price increase, although that rolling measure reflects the advancing forecast window as well as revisions to expectations: earnings are doing far more work than multiples. The question is how much of that profitability can be sustained if the extraordinary AI investment cycle moderates.
AI: A Financing Question, Not Yet a Demand Collapse
There is plenty of evidence that the AI investment cycle is real. Demand for advanced semiconductors, high-bandwidth memory and manufacturing equipment remains strong; computing capacity is expanding and more capable systems are entering business workflows. Not every data centre will earn an attractive return, but falling share prices are not proof that customer demand has collapsed.
Meta illustrated the tension. Revenue rose 26% to $64.6 billion, yet investors concentrated on vast infrastructure commitments and pressure on free cash flow. Capital spending, including principal payments on finance leases, reached $34.91 billion, exceeding operating cash flow of $32.79 billion and leaving free cash flow negative by $2.12 billion. A separate $9.89 billion litigation charge also depressed reported operating profit. The advertising business remains powerful, but investors want clearer evidence that the next wave of AI spending will earn attractive returns.
Meta also announced a new class of non-voting shares to increase its financing flexibility. The initial stock dividend raises no cash; any subsequent issuance would be a separate financing decision.
Credit markets are asking a related question. The rising cost of insuring debt against default at AI-linked borrowers such as Oracle and CoreWeave shows investors becoming more discriminating about financing risk. I see that as capital discipline, not necessarily the beginning of a bust. I would become more concerned if financing stress spread to sound operators and forced genuine customers to cut investment. So far the evidence does not justify that conclusion.
Lower AI usage prices should encourage adoption, but they also oblige providers to work harder to earn adequate returns. The technology can transform productivity over time without every infrastructure investment proving profitable. Both propositions can be true.
Bonds, Inflation and Political Risk
The bond market makes today’s comparison with 2018 more difficult. US ten-year yields recently touched around 5.35% before falling to 4.96% on 22 October, with some of the decline consistent with investors seeking safety during the equity sell-off. That reversal is encouraging, but inflation is far from defeated. Vigorous US activity, elevated energy costs and sticky underlying prices leave the Federal Reserve uncomfortable. A pause on Wednesday looks plausible, even with further tightening priced for December.
The Middle East remains the clearest threat to our constructive view. December Brent crude settled at $116.72 a barrel on Friday; further escalation could force energy prices and bond yields higher, squeezing households and valuations. Conversely, a diplomatic breakthrough could lift a substantial weight from markets. Greater tension around and after the midterms is a risk worth considering, but not a certainty.
The charts show that the global bond index remains slightly negative in US dollars this year, despite the recent Treasury rally. That contrasts with its positive return over the full 2018–19 period illustrated, although the different horizons do not establish how reliably bonds will cushion an equity sell-off. Higher yields offer useful income, while duration still carries inflation risk.
A Quiet Budget Would Be Welcome
Wednesday also brings a British Budget apparently designed to be as unexciting as possible. That may be what gilt investors most want. With little fiscal headroom and costly borrowing, avoiding surprises and preserving credibility could be achievements in their own right.
UK business surveys surprised positively, with October’s flash composite PMI rising to 53.1 and suggesting firmer private-sector activity. September’s CPI inflation nevertheless increased to 3.5% from 3.1%, while retail sales volumes fell 0.4% during the month, despite a 0.7% rise over the third quarter. That is a mixed backdrop for the Budget and the Bank of England. The eurozone’s flash composite PMI slipped to 51.9, indicating slower expansion, while France returned to contraction. French fiscal credibility remains a particular concern, with weak political cohesion and expensive borrowing. These contrasting signals underline the value of international diversification, but only where earnings and balance sheets justify valuations.
Asia: China Tests Bear-Market Territory
Asian equities have joined the retreat. Emerging Asia was heading for a fourth weekly decline as technology-heavy markets absorbed the reassessment of AI investment and higher energy costs. China’s CSI 300 slipped into a technical bear market on Thursday, roughly 20% below its June peak. Friday’s 1.7% rebound coincided with heavy trading in ETFs favoured by state-backed investors, suggesting official support, though none was confirmed. Even so, the index recorded an eleventh consecutive weekly decline, its longest losing streak. The problem is not China’s export prowess or industrial capacity; it is sluggish household demand, a troubled property market and disappointment over policy support. State buying may arrest a slide, but restoring the confidence needed to turn industrial achievement into durable equity returns will take longer. Asia still offers opportunity, but selectivity is essential.
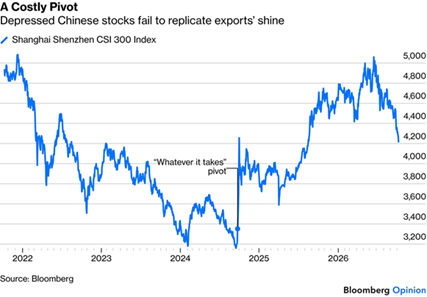
China’s CSI 300 price index, 2022–mid-October 2026. Local-market index points; dividends excluded. This chart predates the latest week’s sell-off and Friday’s rebound. Source: Bloomberg Opinion, Bloomberg data.
This Week
The coming week brings an unusually concentrated test. Wednesday 28 October brings the Federal Reserve’s decision and the UK Budget, followed on Thursday by the first estimate of US third-quarter GDP and September’s PCE inflation figures. Microsoft, Alphabet, Amazon and leading memory manufacturers also report, providing evidence on AI demand, capital spending and monetisation. Changes in guidance and financing costs may matter more than any single day’s share-price reaction.
The 2018 parallel deserves attention, but should not become a trading rule. Investors can be right about long-term earnings while enduring painful valuation adjustments. Healthy profits, less stretched multiples and genuine technological adoption keep me constructive, while further midterm turbulence could create opportunity. The real test is whether profits keep delivering after the voting is over. We should stay alert to that opportunity without pretending to know the precise turning point.
DOWNLOADS
There are currently no downloads associated with this article.